Delhi-NCR dashboard maps hourly air quality by monitoring station
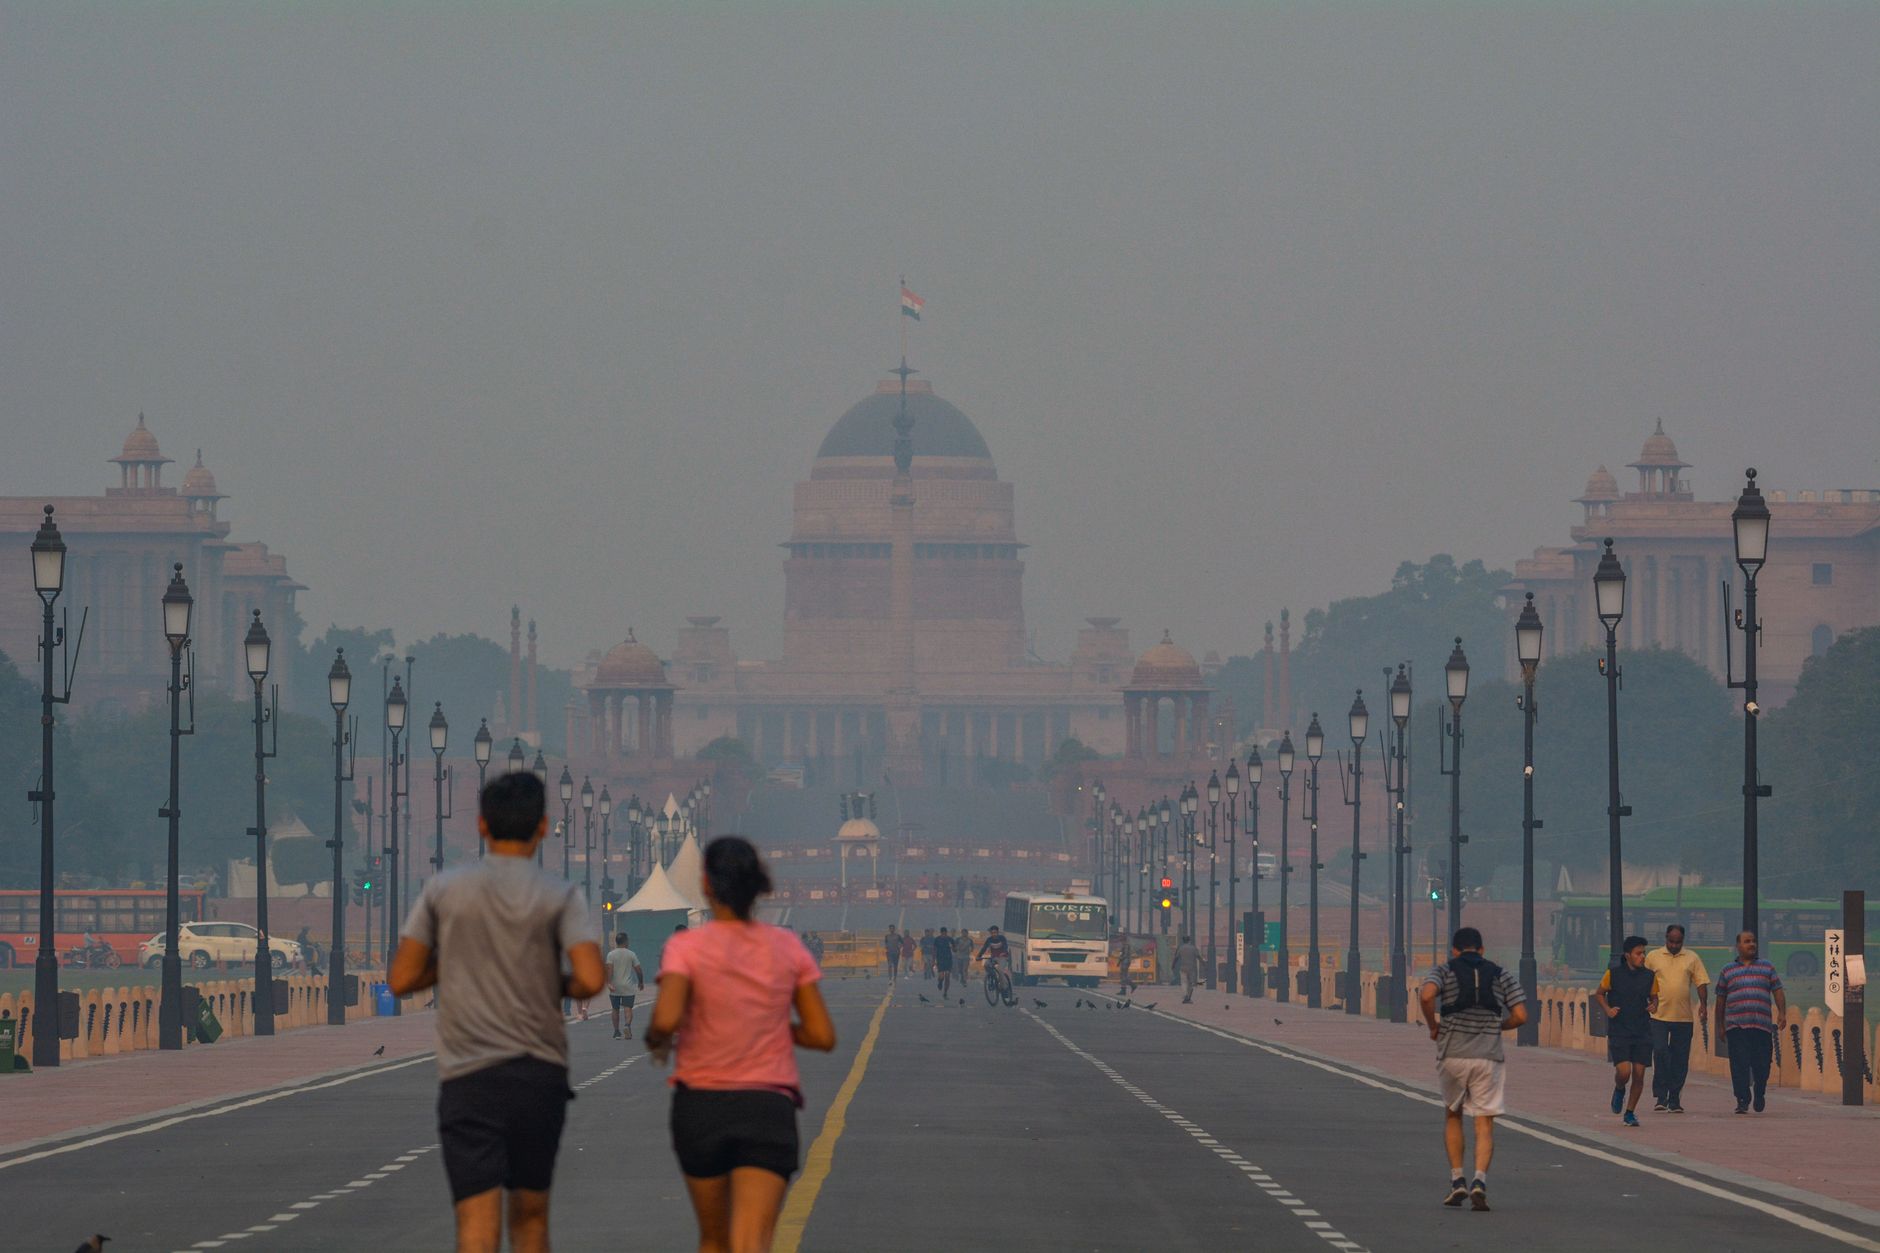
A Delhi-NCR pollution dashboard combines official air-quality readings, weather conditions and farm-fire counts on one screen.
A Delhi-NCR dashboard combines CPCB air-quality readings with weather conditions and farm-fire counts, and identifies the nearest monitoring station.
Delhi’s air-quality index was 350 on Tuesday. At 6pm, Jahangirpuri recorded an AQI of 459, while Lodhi Road recorded 212; 11 of 57 reporting stations were in the severe category.
A new Delhi-NCR dashboard lets residents compare neighbourhood-level readings with wind, rainfall and farm-fire data in one place. It updates hourly using figures from the Central Pollution Control Board (CPCB), India Meteorological Department (IMD) and NASA.
Users can select their location to view the nearest monitoring station. The dashboard also ranks Delhi stations from worst to best, allowing users to compare a neighbourhood reading with the city average.
Alongside hourly readings, it displays CPCB’s daily 4pm bulletin, which measures the preceding 24 hours. It includes wind speed and direction, rainfall at Safdarjung, and an explanation of whether weather conditions are dispersing pollution or allowing it to remain close to the ground.
The dashboard describes its Punjab and Haryana farm-fire count as an undercount, noting that the satellite passes over the region at about 1.30pm while many fires are lit later.
Latest stories
- Bengaluru: Mount Carmel student barred from remaining exams over smart glasses
- Chandni Chowk Town Hall porch section collapses
- Delhi-NCR dashboard maps hourly air quality by monitoring station
- Churchgate–Virar Kavach RFID rollout has 11 tags left
- Ballari Road crossings upgraded at Byatarayanapura and Kodigehalli
- Mumbai’s sewer network reaches 81% of residents; BMC plans expansion
- Bengaluru duo Ashwin Mandoth, Vivek Kiran release ‘Neenillade’
- Delhi: MCD asked to plan waste removal at 125 railway-track sites
- Koramangala café hosts kintsugi workshop and miniature painting
- Ranbir Kapoor, Sunny Deol join Mumbai screening of Ramayana: Part 1
- Bengaluru malls line up Deepavali décor, workshops and dance nights
- ‘Belonging’ brings three artistic languages to Nariman Point
- Delhi weather: dry forecast for November 4, IMD says
- Narela DDA flats booked; LG seeks water, buses and police services
- Bengaluru trio win cake-sculpting title in Australia
- BEST adds 44 AC electric buses at Magathane Depot
- Bandra West café cat found, adopted after Chaayos relocation
- Goregaon education summit on AI and teaching set for 3–4 November
- Chandan Roy draws on nine Mumbai years for cab-driver role in Aakhri Ride
- UPSRTC plans bus shelters near Jewar-Kishorpur Road in Greater Noida
Cities
- Delhi news
- Gurgaon news
- Noida news
- Greater Noida news
- Ghaziabad news
- Faridabad news
- Delhi NCR news
- Bengaluru news
- Mumbai news
- Navi Mumbai news
- Thane news
Sections
- Top Stories
- Latest
- Politics
- Governance
- Civic Issues
- Transport and Traffic
- Metro
- Roads and Infrastructure
- Weather and Air Quality
- Business and Startups
- Real Estate
- Education
- Health
- Environment
- Courts and Policy
- Safety
- Arts and Culture
- Events
- Things To Do
- Food and Drink
- New Openings
- Shopping
- Nightlife
- Neighbourhoods
- People
- Technology
- Sports
GTK covers the news, people, culture, neighbourhoods, civic life and food shaping India’s cities. Better Starts With Us.